Authors:
Bogdan-Andrei Iancu
Daniel-Constantin Mierla
1. Overview
2. Transaction Module Performance Tests
2.1. Transaction-oriented tests
2.2. Call-oriented tests
3. User Location Performance Tests
3.1. New registrations
3.2. Update registrations
3.3. User location lookup
4. Conclusions
5. Notes
6. References
These tests were intended to show the performances of Transaction Module (tm module) and User Location (registrar + usrloc modules) implementations in Kamailio (OpenSER) v1.2.0.
All tests were focus on the relaying capabilities of the TM module. The general design for test scenarios was based on a middle proxy (tested object) between UAC and UAS entities ( UAC <-> proxy <-> UAS )
Two types of tests were performed:
First set of tests was intended to show performances in updating user location table. usrloc was configured with "db_mode=2", meaning that will store new user location records back in MySQL database every 60seconds.
Second set of tests targeted the performances of looking up a record in location table. The location table is cached in memory, there is no database interaction.
As load generator (UAC side) it was used sipp-1.1rc8 (sipp is available at: http://sipp.sourceforge.net)
For Kamailio (OpenSER) proxy, the SVN version (branch 1.2) from 12 March 2007 was used. No packages or binaries were used, sources being locally compiled on the test machine. Kamailio (OpenSER) was compiled with default options (no custom changes at compile time), all configuration being done at runtime. For all tests, the config file is attached. Only exception was the compile time "tinfo=yes" for enabling timestamp logging from script.
For UAS side, another Kamailio (OpenSER) was used (same version) for the simple purpose of "200 OK" replying all the received replies. See here the configuration file.
All used SIP-related software was configured to use UDP as transport protocol for SIP.
A three hardware servers platform was used for the all the tests. Two identical servers (S1) were used to generate load in parallel via a UAC-like software The third server (S2) was running the openser proxy and a UAS-like software.
Description of the used servers:
Kamailio (OpenSER) was started with 768MB of share memory (parameter: -m 768).
SIPP was used to generate 400 000 MESSAGE requests via the tested proxy. The results reflects the capacity (number of transactions per second) and speed (average response time).
SIP entities definition:
SIP messages flow:
| UAC | --->MESSAGE---> | Proxy | --->MESSAGE---> | UAS |
| UAC | <---200 OK<--- | Proxy | <---200 OK<--- | UAS |
In this tests, two parallel UACs were used to generated a high volume of SIP traffic.
SIPP command:
Kamailio (OpenSER) Proxy config file:
Simple statefull relay configuration file
Results reported by SIPP on the UAC servers:
| UAC1 (192.168.2.100:5060) | ||
| Iterations | 200000 | |
| Max concurrent requests | 70 | |
| Max allowed Rate | 10000 | requests per second |
| Average Request Rate | 8047.966 | requests per second |
| Failures | 0 | |
| Retransmissions | 0 | |
| Timeout | 0 | |
| Elapsed Time | 00:00:24:851 | hour:min:sec:msec |
| Full screen can be found here | ||
| UAC2 (192.168.2.101:5060) | ||
| Iterations | 200000 | |
| Max concurrent requests | 70 | |
| Max allowed Rate | 10000 | requests per second |
| Average Request Rate | 7427.765 | requests per second |
| Failures | 0 | |
| Retransmissions | 0 | |
| Timeout | 0 | |
| Elapsed Time | 00:00:26:926 | hour:min:sec:msec |
| Full screen can be found here | ||
By cumulating the results provided by both UACs, it results an
overall throughput of about 15000 transactions per second
for the SIP proxy.
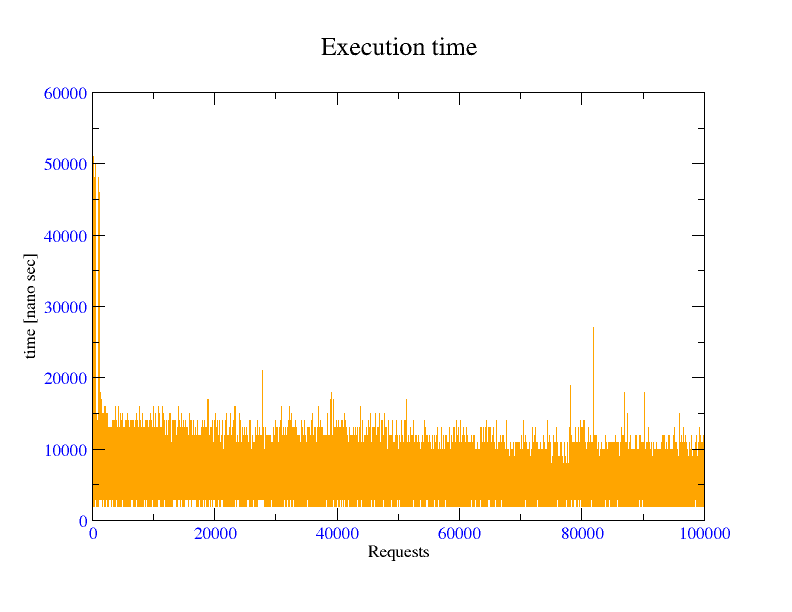
Based on direct information provided by the openser proxy, this is the graphic representation of execution time for t_relay() in Kamailio (OpenSER): openser.cfg
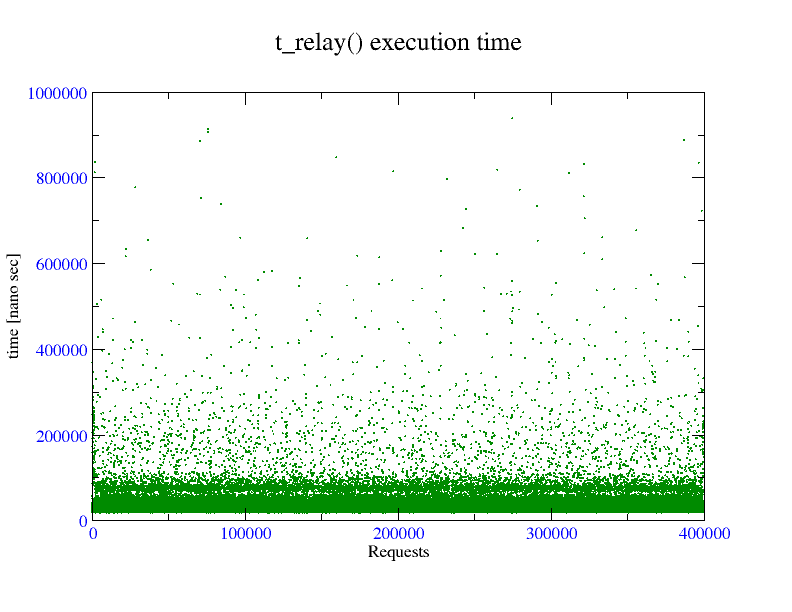
As observation, most of execution times are below 0.1 milliseconds.
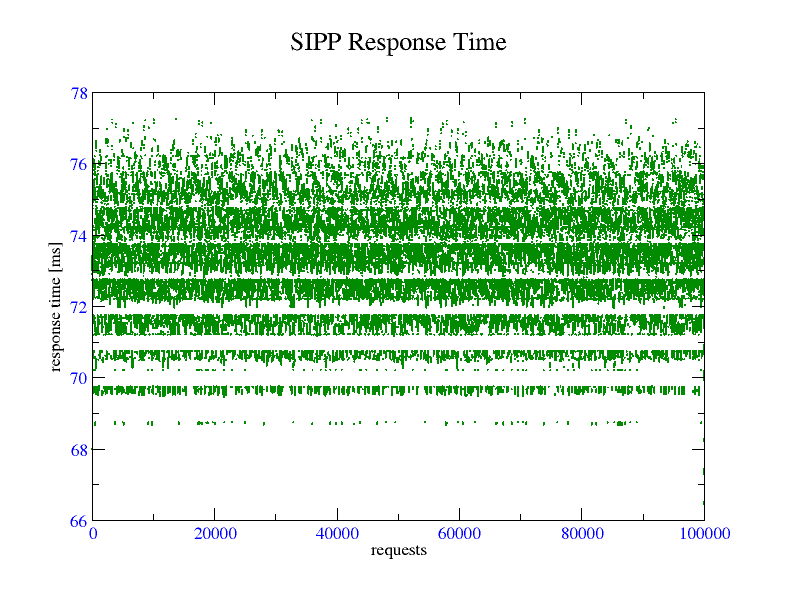
Based on direct information provided by the SIPP application (extra -trace_rtt parameter), these are the graphic representations for the response time (the time required - from UAC point of view- to complete a transaction)
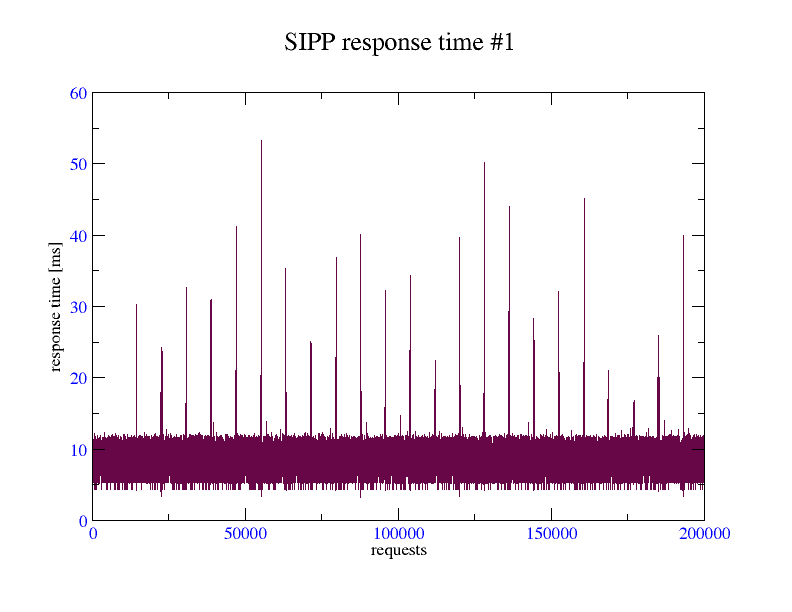
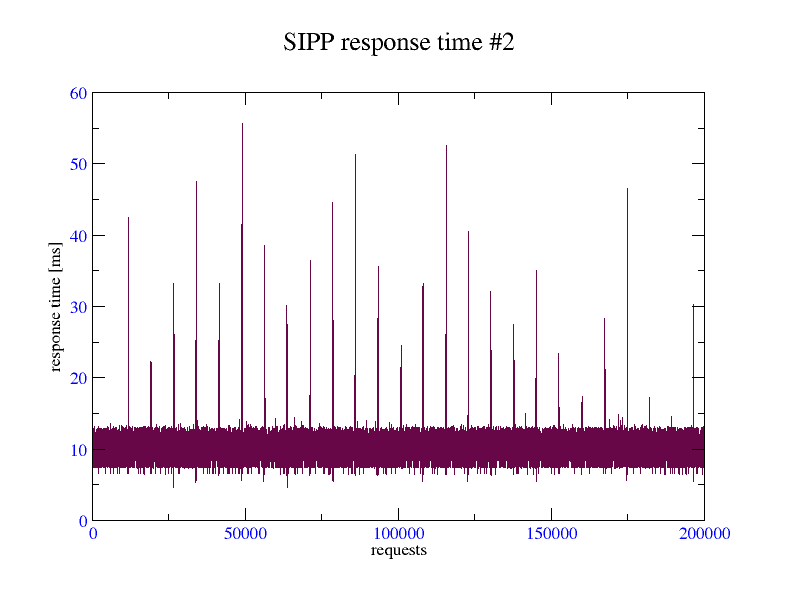
As the response time is from UAC perspective, it includes the network delays and the required time to respond for UAS, so from openser testing point of view it is not so relevant.
What is interesting here to observe are the peaks which shows the openser internal timers activity. Requests processed in the same time with the timer hits are delayed due synchronization (locking) on timer lists.
.Kamailio (OpenSER) was started with 768MB of share memory (parameter: -m 768).
SIPP was used to generate 400 000 complete calls (setup and termination) via the tested proxy. The results reflects the capacity (number of calls per second) and speed (average response time).
SIP entities definition:
SIP messages flow for one call:
| UAC | --->INVITE---> | Proxy | ||
| UAC | <---100 Trying<--- | Proxy | ||
| Proxy | --->INVITE---> | UAS | ||
| UAC | <---200 OK<--- | Proxy | <---200 OK<--- | UAS |
| UAC | --->ACK---> | Proxy | --->ACK---> | UAS |
| UAC | --->BYE---> | Proxy | --->BYE---> | UAS |
| UAC | <---200 OK<--- | Proxy | <---200 OK<--- | UAS |
In this tests, two parallel UACs were used to generated a high volume of SIP traffic.
SIPP command:
Kamailio (OpenSER) Proxy config file:
Simple statefull relay configuration file
Results reported by SIPP on the UAC servers:
| UAC1 (192.168.2.100:5060) | ||
| Iterations | 200000 | |
| Max concurrent calls | 27 | |
| Max allowed Rate | 7000 | calls per second |
| Average Call Rate | 4164.758 | calls per second |
| Failures | 0 | |
| Retransmissions | 0 | |
| Timeout | 0 | |
| Elapsed Time | 00:00:48:022 | hour:min:sec:msec |
| Full screen can be found here | ||
| UAC2 (192.168.2.101:5060) | ||
| Iterations | 200000 | |
| Max concurrent calls | 27 | |
| Max allowed Rate | 7000 | calls per second |
| Average Request Rate | 3896.661 | calls per second |
| Failures | 0 | |
| Retransmissions | 0 | |
| Timeout | 0 | |
| Elapsed Time | 00:00:51:326 | hour:min:sec:msec |
| Full screen can be found here | ||
By cumulating the results provided by both UACs, it results an
overall throughput of about 8060 complete calls per second
for the SIP proxy.
Based on direct information provided by the SIPP application (extra -trace_rtt parameter), these are the graphic representations for the response time (the time required - from UAC point of view- to initiate and terminate a call)
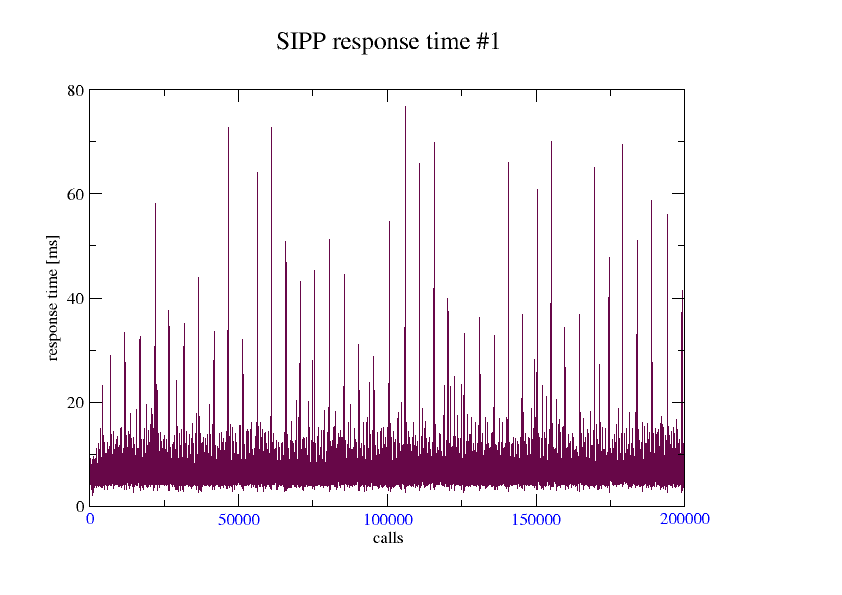
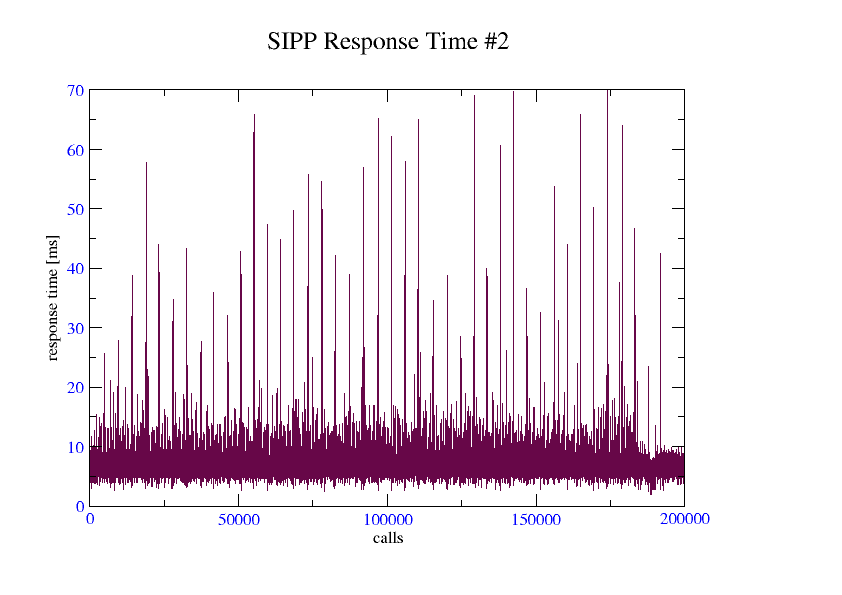
As the response time is from UAC perspective, it includes the network delays and the required time to respond for UAS, so from openser testing point of view it is not so relevant.
What is interesting here to observe are the peaks which shows the openser internal timers activity. Requests processed in the same time with the timer hits are delayed due synchronization (locking) on timer lists.
Another quite interesting think is if we roughly consider the call as composed from 2 transactions, we get a 16000 transactions per second, which is approximately the same with the result from the transaction test.
.Kamailio (OpenSER) was started with 512MB of share memory (parameter: -m 512).
The requests were initiated only by a single instance of sipp. The CPU usage on SIP registrar was low -- using a distributed requests initiator would reflect better registrar's capacity.
.sipp was used to inject 100 000 location contacts from a file containing 8-digits numbers, starting with 91, in linear order. The location table was empty, trying to catch here the time required to create location record.
SIP entities definition:
SIP messages flow:
| UAC | --->REGISTER---> | Proxy |
| UAC | <---200 OK<--- | Proxy |
Results reported by SIPP:
| Iterations | 100000 | |
| Max concurent calls | 100 | |
| Max allowed Rate | 20000 | requests per second |
| Average Call Rate | 7692.899 | requests per second |
| Failures | 0 | |
| Retransmissions | 0 | |
| Timeout | 0 | |
| Elapsed Time | 00:00:12:999 | hour:min:sec:msec |
| Full screen can be found here | ||
overall throughput of over 7600 complete new registrations per second
To measure the response time of SIPP, we deactivated the logging of execution time, since syslog daemon was eating lot of CPU.
Kamailio (OpenSER) Proxy config file:Simple registrar with no execution time logging openser.cfg
Graphic representation of SIPP response time:
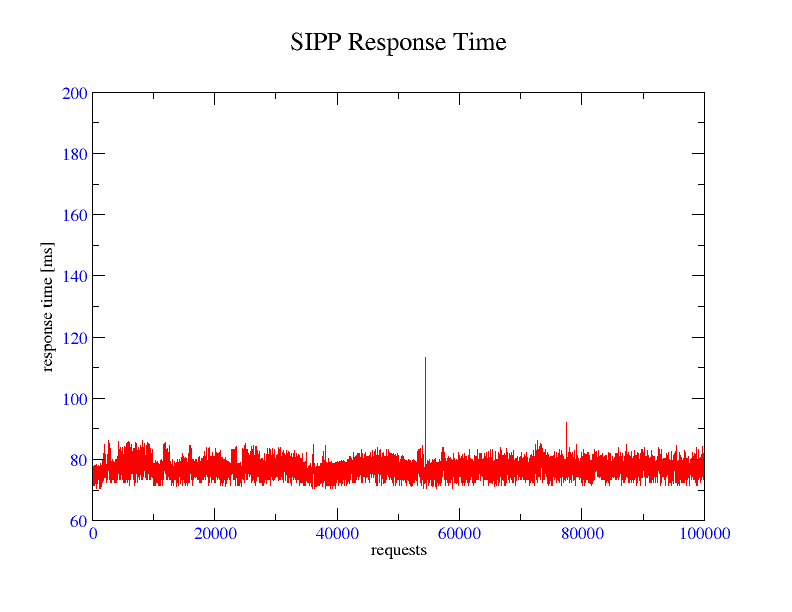
NOTE: the response time reflects full procesing operations, including generation of SIP reply.
Simple registrar with execution time logging: openser.cfg
Graphic representation of execution time for save("location") in Kamailio (OpenSER):
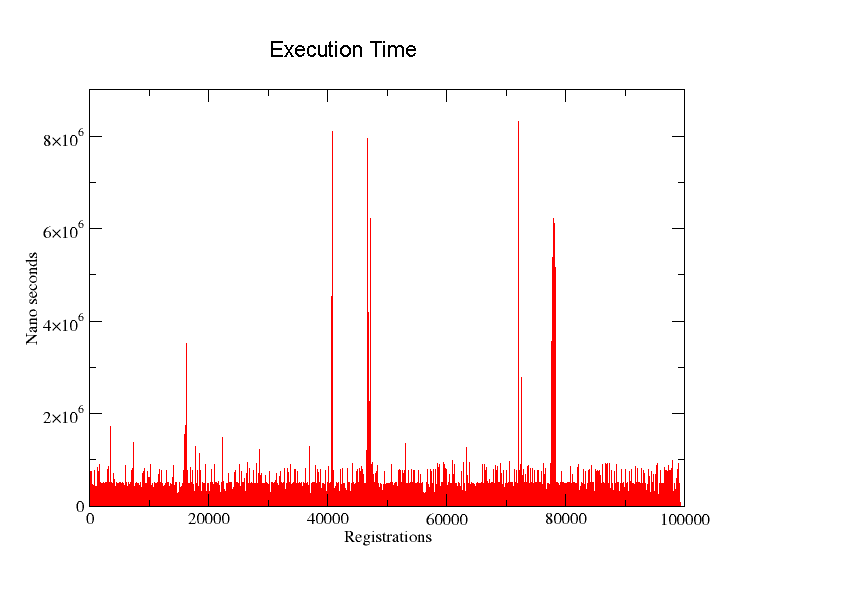
From observations, response time get's higher when timer fires to check expired contacts. Most of execution times are below 100 micro seconds.
.sipp was used to inject 100 000 location contacts from a file containing 8-digits numbers, starting with 91, in random order, for a more realistic simulation. uac-reg.xml from previous test was edited and CSeq was incremented by 1 to simulate a registration update. All SIP accounts used in REGISTERs were already in location table. In this case the location records was not created, but just updated with new values.
SIP entities definition:
SIP messages flow:
| UAC | --->REGISTER---> | Proxy |
| UAC | <---200 OK<--- | Proxy |
Results reported by SIPP:
| Iterations | 100000 | |
| Max concurent calls | 100 | |
| Max allowed Rate | 20000 | requests per second |
| Average Call Rate | 10082.678 | requests per second |
| Failures | 0 | |
| Retransmissions | 0 | |
| Timeout | 0 | |
| Elapsed Time | 00:00:09:918 | hour:min:sec:msec |
| Full screen can be found here | ||
overall throughput of over 10000 complete updated registrations per second
To measure the response time of SIPP, we deactivated the logging of execution time, since syslog daemon was eating lot of CPU.
Kamailio(OpenSER) Proxy config file:Simple registrar with no execution time logging: openser.cfg
Graphic representation of SIPP response time:
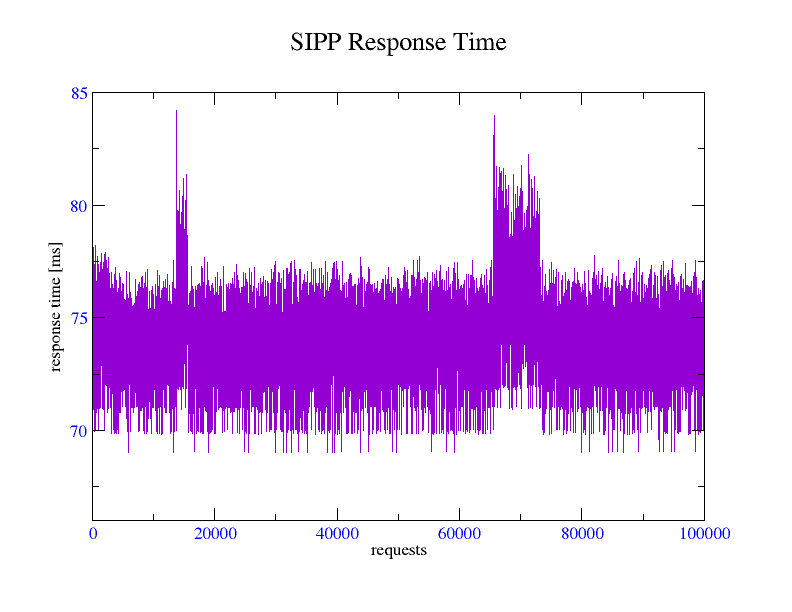
NOTE: the response time reflects full procesing operations, including generation of SIP reply.
It can be observed a significant improvement in performances comparing with previous test, due to less memory operations.
.sipp was used to send 100 000 MESSAGE from a file containing 8-digits numbers, starting with 91, in random order. All users in MESSAGEs' R-URI were in location table.
SIP entities definition:
SIP messages flow:
| UAC | --->MESSAGE---> | Proxy |
| UAC | <---200 OK<--- | Proxy |
Results reported by SIPP:
| Iterations | 100000 | |
| Max concurent calls | 100 | |
| Max allowed Rate | 20000 | requests per second |
| Average Call Rate | 10488.777 | requests per second |
| Failures | 0 | |
| Retransmissions | 0 | |
| Timeout | 0 | |
| Elapsed Time | 00:00:09:534 | hour:min:sec:msec |
| Full screen can be found here | ||
overall throughput of about 10500 user location lookups per second
To measure the response time of SIPP, we deactivated the logging of execution time, since syslog daemon was eating lot of CPU.
Kamailio (OpenSER) Proxy config file:Simple registrar with no execution time logging: openser.cfg
Graphic representation of SIPP response time:
NOTE: the response time reflects full procesing operations, including generation of SIP reply.
Configuration file openser.cfg
Graphic representation of execution time for lookup("location") in Kamailio (OpenSER), for a set of 100 000 operations:
Higher values are expected to be hash entry collisions together with timer firing for expired contacts cleanup.
.The above results are quite technical, so we try to present them in a realistic mode.
When comes to transaction module, I think the relevant tests are the ones for complete calls -- how many calls the system can handle (see tests here). Of course, the tests cover the TM performance only, but in case of a load balancer, the overhead added by extra processing should be quite minimal comparing with TM processing.
The results showed ability to handle about 8000 complete calls per seconds, than means about 480 000 complete calls per minute and 28 800 000 complete calls per hour.
Given these numbers, we consider that processing of transactions becomes prety much insignificant. What will matter will be database responsiveness, and call routing logic in configuration file.
The average expires time for a registration is about 10 min (600sec), considering that, the system would be able to handle at least the registrations comming from 4 020 000 (600 * 6700) subscribers at run time. The number is pretty much over the population someone will assign to a SIP Registrar server in real-world case.
As aside note, Kamailio (OpenSER) 1.2.0 user location uses DB fetch support to load entries from MySQL database at startup, getting rid of "out of private memory" issue present in all old versions when dealing with large online subscriber population (old workaround was to recompile Kamailio (OpenSER) with higher value for private memory). Another feature is that only one child process is loading the records from database, while the others become ready to process SIP traffic (old behaviour was to have all processes waiting to load location database).
.It is important to understand that these tests actually measure the performance of the testbed and not only the performance of the Kamailio (OpenSER) proxy itself (as a separate component).
There a lot of other factors (non-openser related) that are reflected in the results:
Kamailio (OpenSER) - Open Source SIP Server
SIPP - Open Source SIP Testing Tool